How do you know if you have enough detections?
Security leaders frequently ask a deceptively simple question: do we have enough detections? After years of working in detection engineering, I haven’t found a satisfying answer, so this post will introduce ACRE (ATT&CK Coverage Ratio Evaluation), a metric designed to answer that question in a way that is intuitive, time‑bound, and meaningful across organizations.
The Heatmap Problem: “Enough” Is Undefined
Most organizations attempt to answer detection sufficiency by mapping their rules to MITRE ATT&CK® and visualizing coverage using heatmaps. ATT&CK will show a vast number of techniques that attackers can use to achieve their objective, so it seems wise for us to try to detect all of them. The intent is good—but the results are often misleading.1 A typical ATT&CK heatmap could look like the one below:
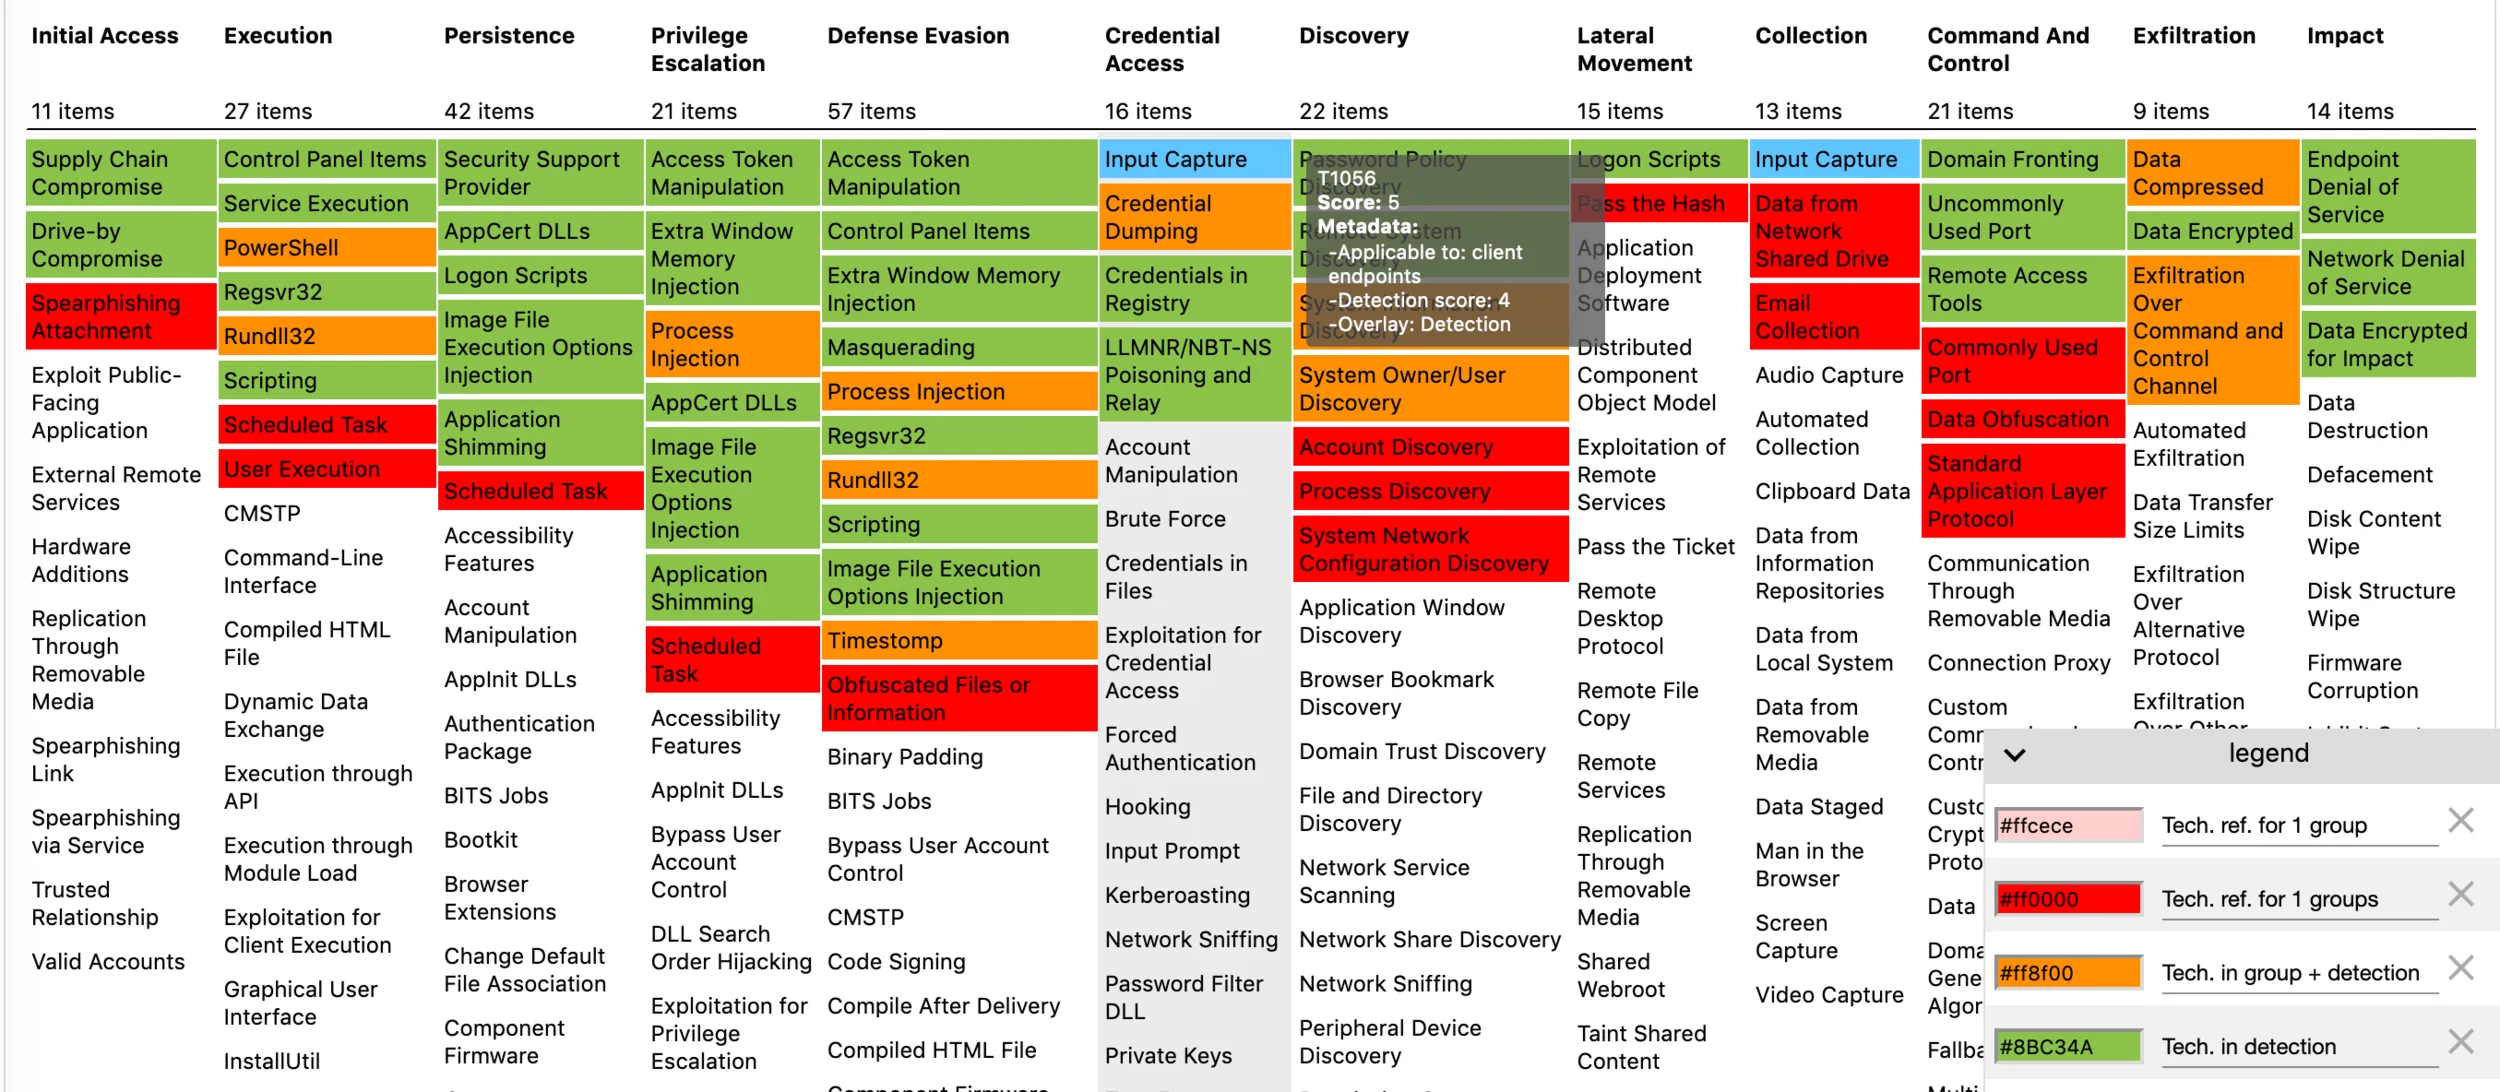 Heatmap A, src
Heatmaps like this raise more questions than they answer, especially when they are being shown to senior management:
- What does “good” coverage look like?
- Should every technique be green? Is that even possible?
- What should we do next to improve? Should we turn the colorless parts to red? Should we make the red cells yellow? What are the thresholds for the colors anyway?
Because a heatmap (especially one derived from ATT&CK Navigator, a wonderfully flexible tool) can represent anything we want, and the colors/gradients can also represent anything we want, we must have a reason or a standard for consistent representation. In other words, the heatmap alone does not answer the question “Is this enough?“.
Another major challenge is that heatmaps are too complex to show progress. Look at Heatmap A and newly introduced Heatmap B. Let’s assume they represent two snapshots from the same organization. Which one do you think came first? If you were presenting this to an executive, what story would you tell about the changes?
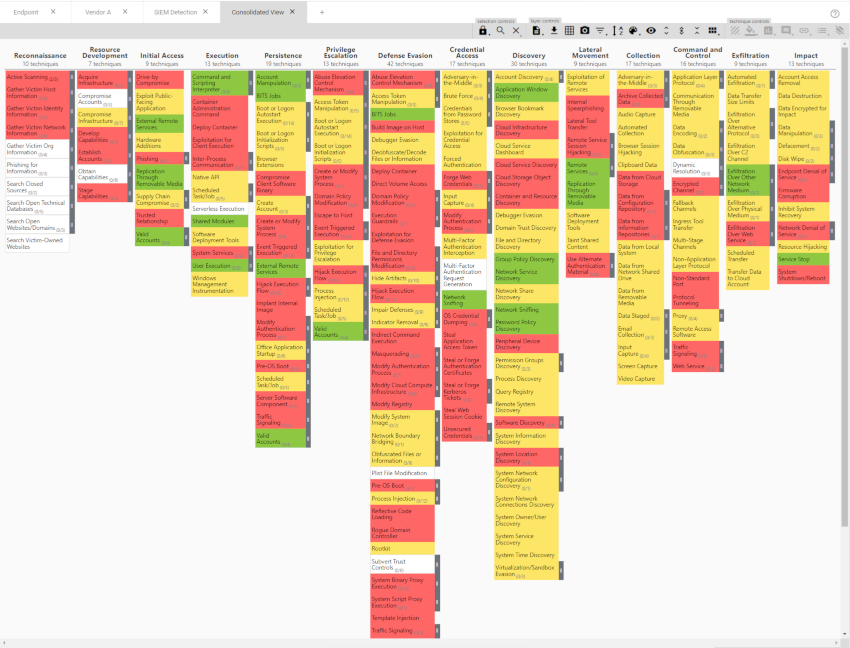 Heatmap B, from this helpful reference on how to use ATT&CK Navigator
One more substantial problem is that MITRE ATT&CK® is not flat — but a heatmap is. That’s normal for models (“all models are wrong, some are useful”), but it means using a flat heatmap to show detection coverage specifically will oversimplify things to a non-useful degree.
Heatmaps fail to define a clear goal, allow measured progress, or guide prioritization decisions. They don’t tell us whether we should add detections where we have none, or improve detections where we already have some. In short:
While ATT&CK heatmaps can be useful tools, they should not be used to track detection coverage!
What a Useful Metric Looks Like
Before introducing a solution, it’s worth defining what standards we should use to evaluate it. A useful detection coverage metric must be:
- Intuitive – an executive should understand it without explanation
- Time‑bound – it should show improvement or regression over time
- Aligned – it should improve as teams do meaningful detection work
- Translatable – it should be meaningful across organizations
Traditional metrics like “number of alerts” or “attacks blocked” fail these tests. Detection coverage, however, can meet them—if measured correctly.
ACRE methodology
ACRE stands for ATT&CK Coverage Ratio Evaluation. At its core, ACRE is a ratio:
(Techniques we detect)2 / (Techniques that are detectable)
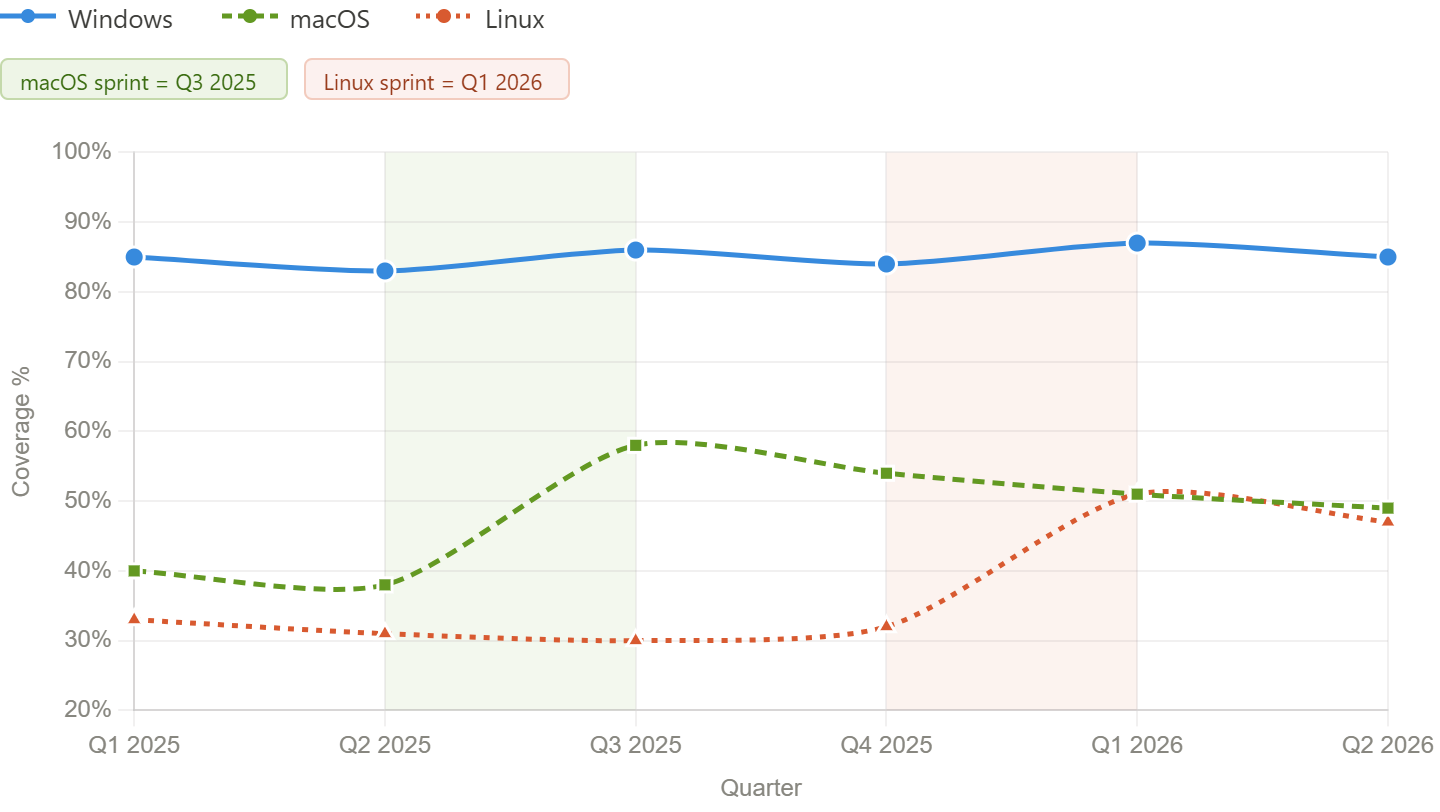
Putting ACRE into a time-series line chart addresses all of our problems:
- Inherently time-bound
- Intuitive (“line go up” is a straightforward way to know if things are going well)
- Aligned to detection engineering technical outcomes, not just tracking activity
- Translates well across organizations through a consistent measurement
Over two years of generating this metric at my organization, it has helped uncover real detection gaps, accurately represent detection engineering work to leadership, and justify investment in collaborative detection research. However, producing this simple ratio required solving three hard problems:
- What should the denominator be for this evaluation?
- What ATT&CK techniques are actually detectable?
- What counts toward the numerator?
Problem 1: Defining the Denominator
Many teams default to using all ATT&CK techniques as the denominator (this is inherent to the heatmap visualization as well). This is flawed. ATT&CK includes techniques that cannot be detected today or perhaps ever (insufficient telemetry) and some that can never be completely detected (due to breadth of the technique) - in other words, some techniques should only be detected opportunistically.
Including techniques like these in coverage assessments makes “100% coverage” impossible and meaningless. The denominator must be limited to techniques that are realistically detectable.
Of course, there’s the other side of the problem as well, where ATT&CK does not include the entire denominator. The project was originally designed (in 2013) to focus on “Windows enterprise networks” and “endpoint telemetry” (per the FAQ, and while ATT&CK has grown to include other platforms since then (see ATT&CK platform overview), most techniques are linked to Windows endpoints. But given MITRE ATT&CK is the best-defined technique inventory we have, we should adopt a satisficing approach (a term coined by Herbert A. Simon) and use realistically detectable ATT&CK techniques as our denominator for now (while we build out what other techniques might be missing, especially for other platforms like Trusted Service Infrastructure (TSI)).
Problem 2: Determining What Is Detectable
Manually evaluating hundreds of ATT&CK techniques is impractical and could lead to inconsistent results. Instead, ACRE leverages MITRE CAR Coverage, which compares multiple open‑source detection libraries and shows what techniques are commonly detected. This provides a defensible, evidence‑based answer to the question:
If multiple independent detection libraries detect this technique, it is detectable.
That said, CAR-based coverage (derived from the website above) has limitations:
- It does not cleanly separate coverage by operating system (if a cross-OS technique like PowerShell shows up in any detection library for any OS, it’s counted as covered)
- It can overcount detections via naive string matching3
- The calculation list is outdated (some techniques listed in CAR (like T1108) have since been deprecated)
To address this, ACRE:
- Splits coverage analysis by OS (see MITRE ATT&CK® is not flat)
- Parses library detection formats rather than string-searching for technique IDs
- Defines a minimum rule count for detectability (avoiding cases where a rule author incorrectly applies a technique ID)
Furthermore, since we should comprehensively detect the middle of the attack, ACRE applies a higher weight for covering techniques in mid-stage tactics (effectively, after execution but before impact).
Problem 3: Defining the Numerator
The hardest question is deceptively simple: How many detections are “enough” for a technique?
My thinking on this topic is evolving - I now think the answer depends on the type of technique — but some standard principles remain.
Summiting the Pyramid Levels shows that many existing detections look at ephemeral or tool-based properties, detecting “instances” rather than “procedures”. We cannot know how many level 1-3 detections are necessary to cover a technique, because new tools can be created at any point, obviating the detections.
However, approaches like the Technique Research Report (TRR) show us that we can identify all possible procedures for many techniques. With a complete list of procedures for all techniques we need to monitor, we could measure our detections against that procedure list. Unfortunately, there are many more techniques to research and document in this way, and building out the full procedure list will take time (and collaborative research). Until then, ACRE adopts the satisficing approach again:
If we have at least one valid detection for a technique x Host OS pair, we count it as covered.
This allows us to measure breadth of coverage, even if depth remains unmeasured. In other words, the metric will show where some ATT&CK techniques are completely uncovered, which should be used to drive detection research projects (why are those gaps uncovered)? Better yet, because ACRE uses open-source rules as the source, there’s a ready-made reference to see what types of rules could be added to fill the gap.
Using ACRE
For all that background, it’s quite easy to use ACRE.
- Generate your ACRE score and find gaps with skills I’ve provided below.
- Do this regularly - at least quarterly - so you can get credit for your detection improvements and see if the denominator (detectable techniques) evolves.
Generating ACRE score
- Use the provided platform-coverage skill and the Security-Detections-MCP to calculate which techniques are detectable (solving problem 2)
- Note: the skill is written to work with Claude Code, but any GenAI product should be able to adapt it. Just ask!
- Also, your GenAI product should be able to install the MCP for you - note that if you’re using Windows, it’s much easier to use Windows Subsystem for Linux (WSL) than the native Windows installation.
- Export your custom detections and run the acre-coverage skill to calculate your ACRE score (solving problem 3). Your export must include the following fields for each rule:
- Creation Date
- MITRE ATT&CK techniques that the rule covers
- OS the rule covers — if your export doesn’t include this, ask a GenAI tool to infer it from your data source or log source field
- Rule name and/or ID (for subsequent human analysis)
- After running those two skills, you’ll get a report and an
acre-history.jsonfile you can use to track progress over time. Export the data to Excel, add a simple line chart, and you have an enterprise-ready metric that’s also useful to defenders.
ACRE output example
Here’s an example of what the acre-coverage skill will generate when you run it:
acre_output-example
ACRE Score Report — 2026-04-13
Scores
Platform ACRE Score Covered Techniques Weighted Score Windows 0.1115 (11.2%) 25 / 226 detectable 35.0 / 314.0 Linux 0.1561 (15.6%) 15 / 98 detectable 21.0 / 134.5 macOS 0.1038 (10.4%) 4 / 39 detectable 5.5 / 53.0 Detectable threshold: ≥5 open-source rules (Sigma + Splunk + Elastic combined)
Tactic weight (1.5×): persistence, privilege-escalation, defense-evasion, credential-access, discovery, lateral-movement, collection
This is the first run — trend history will appear on the next run after you add detections.
Top Coverage Gaps — Windows
320 total gaps across all platforms.
Technique Name Weight Sigma Splunk Elastic T1218 System Binary Proxy Execution 1.5× 140 14 18 T1027 Obfuscated Files or Information 1.5× 85 6 3 T1055 Process Injection 1.5× 26 26 11 T1087.002 Domain Account 1.5× 21 27 7 T1036 Masquerading 1.5× 34 9 11 T1218.005 Mshta 1.5× 7 12 26 T1098 Account Manipulation 1.5× 16 13 18 T1003 OS Credential Dumping 1.5× 23 7 15 T1068 Exploitation for Privilege Escalation 1.5× 10 17 16 T1133 External Remote Services 1.5× 11 31 1 Top Coverage Gaps — Linux
Technique Name Weight Sigma Splunk Elastic T1068 Exploitation for Privilege Escalation 1.5× 5 8 37 T1548.003 Sudo and Sudo Caching 1.5× 0 35 19 T1543 Create or Modify System Process 1.5× 0 3 36 T1574 Hijack Execution Flow 1.5× 0 0 33 T1078 Valid Accounts 1.5× 0 2 32 T1574.006 Dynamic Linker Hijacking 1.5× 2 5 32 T1082 System Information Discovery 1.5× 9 5 23 T1014 Rootkit 1.5× 1 3 22 T1547.006 Kernel Modules and Extensions 1.5× 1 7 20 T1562.001 Disable or Modify Tools 1.5× 3 5 20 Top Coverage Gaps — macOS
Technique Name Weight Sigma Splunk Elastic T1087.002 Domain Account 1.5× 0 11 1 T1562.001 Disable or Modify Tools 1.5× 1 3 8 T1082 System Information Discovery 1.5× 4 2 5 T1133 External Remote Services 1.5× 1 5 4 T1110 Brute Force 1.5× 0 9 1 T1005 Data from Local System 1.5× 0 0 8 T1543.004 Launch Daemon 1.5× 2 0 5 T1555.001 Keychain 1.5× 1 0 5 T1078.003 Local Accounts 1.5× 4 0 5 T1647 Plist File Modification 1.5× 0 1 5
Output Files
Link to original
File Contents acre_current.jsonToday’s scores acre_history.jsonHistory (1 entry — baseline established) acre_gaps.json319 prioritized gaps with rule file paths parsed_detections.json50 normalized detection records
What’s next to improve ACRE?
- Better defining the numerator: how much does a given rule increase coverage?
- Decomposing techniques into TRRs will allow more precise detection measurements, along with a host of other benefits like the ability to validate vendor detection effectiveness
- Better defining the denominator:
- ATT&CK is well-covered for host operating systems, but we need similar data for Trusted Service Infrastructure (TSI) and other types of systems that must be defended
- I’m collecting different types of Technique matrices that will need to be deduplicated and combined to expand the denominator
Footnotes
-
It doesn’t help that MITRE ATT&CK® is not designed for detection! ↩
-
Technically, detection rules can’t detect techniques, but they can detect ATT&CK Procedures and Instances that are linked to a technique. ↩
-
It seems like the data was generated by doing text searches in the detection repos, but that means it matched deprecated Sigma rules or documentation in other repos. ↩